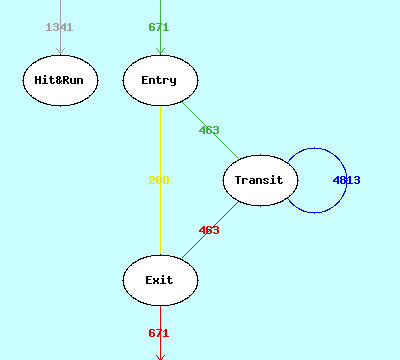
The flow of visitors through your website can be summarised as follows :

Some global web maps are available. Try using aWebVisit-Map for individual page maps...
| Start date | 07/May/2000:08:58:39 |
| End date | 04/Jun/2000:11:35:24 |
| 'Page' hits | 8531 |
| 'Image' hits | 5764 |
| Hits from excluded hosts | |
| Skipped entries | 0 |
| Valid entries | 14295 |
The 'page' hits represent 59.7 % of all valid hits on your website. The 'image' hits are excluded as specified in the current configuration of aWebVisit. You do not need to include or exclude other types of pages for the moment...
This is probably a good number for statistical analysis : enough samples to be useful, but small enough to be processed quickly...
| Visit Type | Visit Count |
Visits (%) |
|---|---|---|
| Normal visits (> 2 hits) | 463 | 16.1 |
| In & Out visits (2 hits) | 208 | 7.2 |
| Hit & Run visits (1 hit) | 1341 | 46.5 |
| Discarded visits (0 hits) | 709 | 24.6 |
| Excluded visits (e.g. robots) | 161 | 5.6 |
| Total visits | 2882 | 100.0 |
23.3 % of your visitors visit at least two pages on your site, which is pretty bad ! Have a closer look at the hit & run pages and see if you might keep them on your site...
| Visit Statistics | Page hits per visit |
Elapsed time per visit |
Time per page (sec) |
|---|---|---|---|
| Minimum | 1 | 00:00:00 | 0.0 |
| Average | 4.0 | 00:11:21 | 76.9 |
| Maximum | 331 | 23:33:17 | 382.0 |
The average visit reaches 0.5 % of all pages (including returns to the same page).
The longest visit in number of hits was from host marvin.northernlight.com on 21/May/2000:03:55:57.
It was also the longest visit in duration.
| Page Type | Hit Count |
Hits (%) |
Page Count |
Pages (%) |
Min. Hits |
Avg. Hits |
Max. Hits |
Max. (%) |
Max. Hits - Page | ||
|---|---|---|---|---|---|---|---|---|---|---|---|
| Entry | 671 | 7.9 | 243 | 30.5 | 1 | 2.8 | 207 | 30.8 | / | ||
| Transit | 5276 | 61.8 | 680 | 85.3 | 1 | 7.8 | 186 | 3.5 | /springfd/index.html | ||
| Exit | 671 | 7.9 | 302 | 37.9 | 1 | 2.2 | 16 | 2.4 | /ridley/index.html | ||
| Hit&Run | 1341 | 15.7 | 470 | 59.0 | 1 | 2.9 | 189 | 14.1 | / | ||
| Total | 8531 | 100.0 | 797 | 100.0 | 1 | 10.7 | 520 | 6.1 | / |
It is worthwhile spending some time on this table. Notice for instance that of the 8531 page visits, 15.7 % are hit & runs. Or that of the 797 different pages on your website, 37.9 % are used as an exit page at least once.
Based on the 671 entries to your website, you can also see that 30.8 % of your visitors use page / to enter your site, and 2.4 % use page /ridley/index.html right before leaving your website. And the same entry page is also responsible for 14.1 % of the hit & runs.
| Link Type | Hit Count |
Hits (%) |
Link Count |
Links (%) |
Min. Hits |
Avg. Hits |
Max. Hits |
Max. (%) |
Max. Hits - From Page | Max. Hits - To Page | ||
|---|---|---|---|---|---|---|---|---|---|---|---|---|
| Incoming | 463 | 7.8 | 279 | 6.8 | 1 | 1.7 | 82 | 17.7 | / | /ridley/index.html | ||
| Internal | 4813 | 80.9 | 3500 | 85.4 | 1 | 1.4 | 24 | 0.5 | / | / | ||
| Outgoing | 463 | 7.8 | 429 | 10.5 | 1 | 1.1 | 4 | 0.9 | /ridley/index.html | /ridley/1262389.html | ||
| In&Out | 208 | 3.5 | 177 | 4.3 | 1 | 1.2 | 7 | 3.4 | / | /orinfo.html | ||
| Total | 5947 | 100.0 | 4099 | 100.0 | 1 | 1.5 | 90 | 1.5 | / | /ridley/index.html |
Interpretation of this table is similar to the one above. Note that redirects by your web server will also appear as links, and that frames will generate links between the main frame and its children.
Since 797 different pages were visited and 4099 different links were followed on your website, we can say that visitors usually follow 5.1 links per page. This means that visitors often use the available hyperlinks on your site.
| Code | Description | Hit Count |
Hits (%) |
|---|---|---|---|
| 200 | Okay | 12587 | 88.1 |
| 206 | Partial Content | 5 | 0.0 |
| 301 | Moved | 29 | 0.2 |
| 304 | Not modified | 1388 | 9.7 |
| 404 | Not Found Requests | 286 | 2.0 |
| Total | 14295 | 100.0 |
The 'usual' status codes, i.e. 200 (Okay) and 304 (Not modified), represent 97.8 % of all hits.
The others are examined in more detail here.
Back to top